The numbers that actually matter to leadership
A Google Data Studio dashboard that filters out operational noise and shows only the KPIs leadership and management steer on — clear, comparable and always up to date.
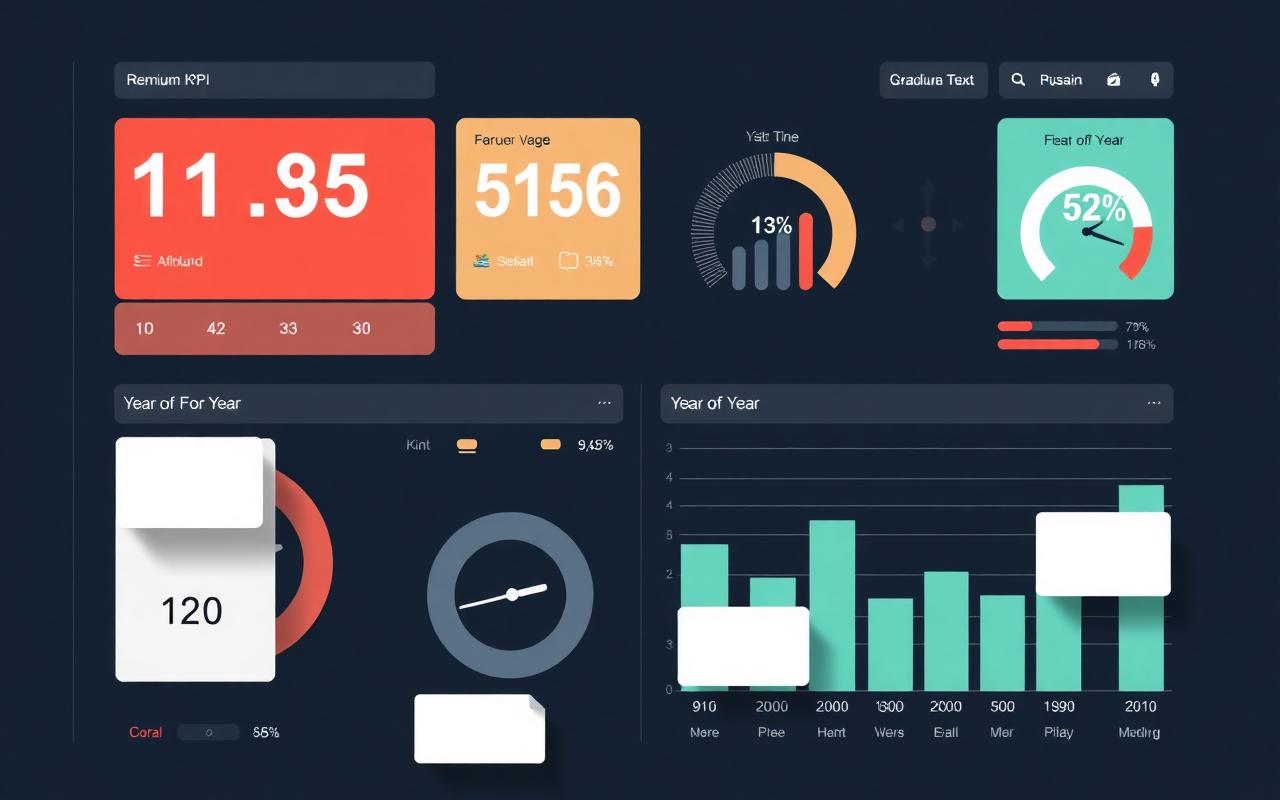
One screen, six-minute meeting
Everything leadership needs to assess the state of the business — without getting lost in operational detail.
KPIs & goals
Goal, actual and gap per KPI, with a clear visual on whether you're on track.
Year-over-year
Compare this year to last year per month, quarter or year.
Trend & forecast
How are numbers developing and where will we land if the trend continues?
Gauges & status
One glance: green, amber, red. No interpretation needed.
For leadership, management and investors
Suited for CEOs, COOs, CFOs, board members and investors who want a reliable, simplified status update monthly or quarterly.
Decide on the right numbers, not the most numbers
Many management reports are 60 pages long and nobody reads them. An Executive KPI Dashboard inverts that: maximum 1 screen, only the numbers strategic decisions are made on. By filtering all noise, leadership finally gets an overview readable in 5 minutes — and current at every board meeting instead of two weeks old.
One source of truth across the whole organisation
When everyone — from marketing to finance to board — looks at the same KPIs with the same definitions, debates about methodology disappear and time remains for decisions. The dashboard refreshes automatically, can be emailed as PDF to stakeholders on schedule and is mobile-friendly for on the go.
Frequently asked questions
Ready for a dashboard that's board-ready?
Book a free dashboard strategy call and co-design your KPI set.
Let's TalkReady to move forward with Executive KPI Dashboard?
Fill in your details. We'll get back to you within 24 hours with a concrete proposal.